Portfolio theory and analysis
Unit: Advanced Financial Management
Premium Topic Resources
Sign in to download the full Topic PDF and enable offline revision mode.
Login to Access
Join the community! 550+ students upgraded in the last 24 hours.
Limited Discount Seats Available
Practice CPA Advanced Financial Management Portfolio theory and analysis questions with detailed answers and explanations.
Access past exam questions by topic, improve your understanding, and download PDF for offline revision.
April 2026
1 Questions
Question 5b
An investment analyst is constructing a portfolio consisting of three shares listed on the NYM Securities
Exchange with the following details:
| Asset | Expected return (%) | Standard deviation (%) | Weight | Beta |
| X | 22.0 | 25.0 | 0.40 | 1.50 |
| Y | 15.0 | 18.0 | 0.35 | 0.80 |
| Z | 18.5 | 20.0 | 0.25 | 1.10 |
Additional information:
- Correlation coefficients between the assets are: XY 0.60; XZ 0.40; YZ 0.50.
- Market return is 14%.
- Risk‑free rate is 8%.
- Market standard deviation is15%.
Required:
(i) Calculate the expected return of the portfolio.
(ii) Determine the standard deviation of the portfolio.
(iii) Decompose the total risk of Asset X into systematic and unsystematic components.
(iv) Determine the required return of the portfolio using the capital asset pricing model (CAPM).
(v) Assess whether the portfolio is underpriced or overpriced.
December 2025
3 Questions
Question 3c
Maridadi Limited, a garment manufacturing firm, is considering a strategic restructuring by diversifying into the electronics business. The anticipated return from the new venture is 18%. To guide its decision, the company intends to apply the Capital Asset Pricing Model (CAPM).
Three potential electronics companies; A Ltd., B Ltd. and C Ltd. have been identified as possible acquisition targets. The following information relates to these firms:
• A Ltd.: Equity beta of 1.5; capital structure consists of 50% debt and 50% equity.
• B Ltd.: Equity beta of 1.4; has recently undertaken an unrelated project representing 20% of its total value, with an asset beta of 1.4. The company is financed by 40% debt and 60% equity.
• C Ltd.: Equity beta of 1.05; capital structure consists of 35% debt and 65% equity.
Additional information:
1. Corporation tax rate is 30%.
2. Maridadi Limited’s debt to equity ratio is 0.70 : 0.30.
3. The expected market return is 15%.
4. Risk-free rate is 12%.
Required:
Using appropriate computations, advise Maridadi Limited on whether it should proceed with the proposed restructuring into the electronics business.
Question 2c
Zigma Limited is a mutual fund investment company and has invested in the following three schemes:
| Scheme | Dividends distributed (Sh.“million”) | Capital appreciation (Sh.“million”) | Opening net asset value (Sh.“million”) | Beta |
| X | 17.5 | 29.7 | 320 | 1.3 |
| Y | 0 | 35.3 | 271.5 | 0.90 |
| Z | 13 | 19.9 | 235 | 1.4 |
Additional information:
1. The treasury bill rate, which is considered risk free, is 7.84%.
2. The market portfolio is 13%.
Required:
(i) Compute Jensen’s alpha of each of the schemes.
(ii) Recommended to Zigma Limited the scheme(s) to continue to invest in based on the scheme’s
performance.
Question 2b
Haraka Company Limited has the following four short term portfolio of investments made from the accumulated
retained earnings over the years:
| Company | Number of Shares | Beta equity Coefficient | Market price per Share(Sh.) | Dividend yield in 2024(%) | Expected return on equity in 2025 (%) |
| W | 120,000 | 1.2 | 42.9 | 6.1 | 9.5 |
| X | 160,000 | 2.3 | 29.2 | 3.4 | 15.5 |
| Y | 200,000 | 0.85 | 21.7 | 5.7 | 12.5 |
| Z | 250,000 | 1.28 | 31.4 | 3.3 | 7.3 |
Additional information:
1. The current market return is 19% per annum.
2. The risk free rate is 12% per annum.
Required:
(i) Calculate the risk of the company’s short term investment portfolio relative to that of the market.
(ii) Recommend, with reasons, whether Haraka Company Limited should change the composition of its
portfolio.
August 2025
1 Questions
Question 2c
Prime Actual Investors Limited have the following portfolio of four risky assets and have deposited in a risk free
asset. The table shows portfolio weightings and the current asset returns together with their beta coefficients:
| Asset | Weightings (%) | Current return (%) | Beta |
| A | 30 | 18 | 1.8 |
| B | 15 | 20 | 2.2 |
| C | 20 | 16 | 1.5 |
| D | 35 | 10 | 1.2 |
| Risk free asset | 30 | 8 | 0 |
The overall return on the market portfolio of risky assets is 12% and this is expected to continue for the foreseeable
future.
Required:
(i) Compute the current return on the portfolio.
(ii) Ascertain the beta value of the portfolio.
(iii) Identify out of the four risky assets, the one(s) that are inefficient/efficient and super-efficient.
(iv) Based on the findings in (c) (iii) above, state the predictions that you would make regarding future asset
values and their rates of return.
(v) Compute the equilibrium return on this portfolio assuming the weightings remain unchanged.
April 2025
3 Questions
Question 4a
Explain FOUR differences between “portfolio theory” and “arbitrage pricing theory”.
Question 4b
The table below gives the end of year levels of the price of an ordinary share in Tausi Ltd. and a representative
stock exchange index:
| Year | Tausi Ltd. share price (Sh.) | Stock Exchange Index |
| 2019 | 75 | 752 |
| 2020 | 78 | 815.5 |
| 2021 | 81 | 875 |
| 2022 | 79 | 840 |
| 2023 | 85 | 900 |
| 2024 | 76.5 | 795 |
Additional information:
1. The risk free rate is 5% per year.
2. The expected return from equities is 8% per year.
Required:
(i) The beta coefficient of Tausi Ltd.’s ordinary shares.
(ii) The required rate of return of Tausi Ltd.’s ordinary shares.
(iii) Assume that the expected rate of return of Tausi Ltd. is 10%. Establish whether Tausi Ltd. share is
undervalued or overvalued.
Question 2b
A financial manager has the following bond portfolio:
| Bond | Price (Sh.) | Yield (%) | Par amount owed (Sh.“million”) | Duration |
| A | 120 | 10 | 4 | 3.86 |
| B | 85.50 | 10 | 5 | 8.05 |
| C | 130.50 | 10 | 3 | 9.17 |
The three bonds are option-free.
Required:
(i) The bond portfolio duration.
(ii) Interpret the result obtained in (b) (i) above.
December 2024
2 Questions
Question 2a
Describe FOUR assumptions of the capital asset pricing model (CAPM).
Question 2b
Peter Mwangangi, an investor at the securities exchange intends to construct a minimum variance portfolio
comprising the shares of two companies; Simba Ltd. and Nyati Ltd. The projected returns on the shares of the
two companies under three different states of the economy are as follows:
| State of economy | Probability | Simba Ltd. (%) | Nyati Ltd. (%) |
| Boom | 0.30 | 18 | 10 |
| Normal | 0.45 | 16 | 14 |
| Recession | 0.25 | 9 | 16 |
Required:
(i) The weights of the two company’s shares in the minimum variance portfolio.
(ii) The expected return for the minimum variance portfolio.
(iii) The standard deviation for the minimum variance portfolio.
August 2024
1 Questions
Question 2b
Kiwanda Ltd., an all equity financed company is contemplating setting up a manufacturing plant overseas.
The expected pay-off from the project would depend on the future state of the economy that might prevail as
shown below:
| State of economy | Probability | Forecasted rate of return (%) |
| A | 0.20 | 10 |
| B | 0.30 | 15 |
| C | 0.40 | 7 |
| D | 0.10 | 12 |
Additional information:
| 1. | The company’s portfolio of existing activities are expected to generate an overall return of 18% with a standard deviation of 5%. |
| 2. | The correlation coefficient of returns of the new project and existing portfolio of activities is 0.60 while its correlation with the market portfolio is 0.24. |
| 3. | The forecasted rate of return of the market portfolio and their probability of occurrence in different states of nature are given as follows: |
| State of economy | Probability | Forecasted rate of return (%) | |
| 1 | 0.20 | 20 | |
| 2 | 0.30 | 15 | |
| 3 | 0.40 | 10 | |
| 4 | 0.10 | 5 | |
| 4. | The risk free rate of return is 8%. | ||
Required:
(i) Compute the covariance of returns of the new project and existing portfolio returns.
(ii) Advise the management of Kiwanda Ltd. on whether to accept the proposed project using the capital
market line (CML) analysis.
(iii) Determine whether the project is acceptable using the Capital Asset Pricing Model (CAPM).
April 2024
2 Questions
Question 2a
Two assets, A and B are known to lie on the security market line (SML). Asset A has a beta of 0.5 and a risk
premium of 4%. Asset B has an expected rate of return of 20% and a beta of 1.75.
You are considering the following securities which are available in the market:
| Security | Expected return (%) | Beta |
| A | 20 | 2.00 |
| B | 14 | 0.75 |
| C | 15 | 1.25 |
| D | 12 | -0.25 |
| E | 31 | 3.25 |
Required:
(i) Determine the risk free rate of return.
(ii) Calculate the required rate of return of each security.
(iii) Identify which security is undervalued, overvalued or correctly valued.
Question 1b
Outline FOUR limitations of Treynor’s measure of portfolio performance.
December 2023
1 Questions
Question 2b
Daniel Wekesa, an investment specialist has been entrusted with Sh.5,000,000 by an investment club and
instructed to invest the money optimally over a 1-year period.
Required:
Part of the instructions are given as follows:
| 1. | The funds be invested in one or more of the three specified projects and in the money market. |
| 2. | The three projects are not divisible and cannot be postponed. |
| 3. | The investment club requires a return of 14% per annum. |
| 4. | The following details relate to the projects and money market: |
| Initial cash outlay Sh. “000" | Forecasted rate of return (%) | Expected standard deviation of return (%) | ||
| Project 1\((P_1)\) | 3,000 | 16 | 8 | |
| Project 2\((P_2)\) | 2,000 | 15 | 6 | |
| Project 3\((P_3)\) | 2,000 | 22 | 10 | |
| Money market (MM) | 3,000 | 12 | 4 | |
| 5. | The correlation coefficients of returns of the above combination of projects are as follows: | |||
| Between projects | Between projects and market portfolio (MP) | Between projects and money market (MM) | Between money market (MM) and market portfolio (MP) | |
| \(P_1\) and\(P_2\) = 0.90 | \(P_1\) and MP = 0.80 | \(P_1\) and MM = 0.30 | MM and MP = 0.40 | |
| \(P_1\) and \(P_3\) = 0.50 | \(P_2\) and MP = 0.10 | \(P_2\) and MM = 0.75 | ||
| \(P_2\) and \(P_3\) = 0.20 | \(P_3\) and MP = 0.65 | \(P_3\) and MM = 0.15 | ||
Additional information:
| 1 | The risk free rate of return is 12%. |
| 2. | Expected return of the market portfolio is a weighted average return. Given below are forecasted rate of returns from a market portfolio and their probability of occurrence in different states of nature: |
| 2. | State of nature | Probability | Forecasted rate of return (%) |
| Recession | 0.30 | 10 | |
| Average | 0.40 | 15 | |
| Boom | 0.30 | 20 |
Required:
Evaluate how Daniel Wekesa should invest the Sh.5 million using:
(i) Capital market line (CML) analysis in portfolio theory.
(ii) Capital asset pricing model (CAPM).
August 2023
2 Questions
Question 1b
Analyse FIVE differences between portfolio theory and capital asset pricing model (CAPM).
Question 1c
Simon Kobia, an investor is evaluating six portfolios with the following characteristics:
| Portfolio | Expected return of the portfolio (%) | Standard deviation of the portfolio (%) |
| 1 | 19 | 8 |
| 2 | 25 | 12 |
| 3 | 16 | 6 |
| 4 | 32 | 16 |
| 5 | 22.5 | 10 |
| 6 | 8 | 2 |
The expected return of the market portfolio is 12% with an accompanying standard deviation of 4% while the risk
free rate of interest is 5%.
Required:
(i) Using capital market line (CML), advise the investor on which portfolio(s) is inefficient, efficient or
superefficient.
(ii) In case of inefficient and superefficient portfolio(s) in (c) (i) above, compute the standard deviation that
the portfolio should have for efficiency to be achieved with the given expected return.
April 2023
2 Questions
Question 1b
Adept Consultants is a research firm that provides market related data for use by market participants. Michael
Aloo is a financial manager at Adept Consultants tasked with estimating stock beta.
Required:
Explain THREE practical considerations that Adept Consultants should take when forecasting beta of an asset.
Question 3c
You have been appointed as a finance manager of Mamba Ltd. After evaluating the investment portfolio of the
company, you have divided the market into four portfolios following two dimensions; value/growth and
small/large.
The weight of each portfolio in the index is given below:
| Portfolio | Weight (%) | Sensitivity to factor 1 (Market beta) | Sensitivity to factor 2 (Price/book) | Sensitivity to factor 3 Average capitalisation |
| Small value | 10 | 0.87 | 0.83 | 2 |
| Small growth | 10 | 0.97 | 0.33 | 2 |
| Large value | 30 | 0.92 | 5 | 20 |
| Large growth | 50 | 1.12 | 6 | 22 |
| Risk premium | - | 8% | –3% | 0.40% |
The risk free rate is 3%.
Required:
(i) Using the arbitrage pricing theory (APT), determine the portfolio that has the highest expected return.
(ii) The portfolio that would maximise your return if you decide to use capital asset pricing model (CAPM).
(iii) In order to diversify his perceived risk, a competitor wants to combine the small value and large growth
portfolios. The new portfolio should have an overall sensitivity to factor 1 (market beta) of 1.
Determine the proportion to be invested in the small value and large growth.
December 2022
2 Questions
Question 2a
The modern portfolio theory (MPT) is a practical method for selecting investments in order to maximise their
overall returns within an acceptable level of risk.
Required:
Outline FIVE assumptions of modern portfolio theory (MPT).
Question 2b
The following information is provided on the market, risk free rate and two stocks A and B:
| Expected return % | Correlation with market | % | |
| Treasury bill rate | 4.00 | 0.00 | 0.00 |
| S & P 500 index | 11 | 1.00 | 15.00 |
| Stock A | 14 | 0.70 | 25.00 |
| Stock B | 9 | 0.40 | 20.00 |
Required:
(i) Draw the capital market line (CML).
(ii) Calculate the betas of Stock A and Stock B.
(iii) Calculate the Alphas (α) of the Stock A and Stock B.
(iv) Plot the Stocks A and Stock B relative to the CML and comment
August 2022
2 Questions
Question 5c
The following information relates to the performance of three portfolios; A, B and C during the year ended
30 June 2022:
| Portfolio | Average return (%) | Standard deviation (%) | Covariance of portfolio return with market returns |
| A | 17.55 | 30 | 0.0088 |
| B | 13.26 | 34 | 0.0750 |
| C | 9.34 | 28 | 0.0021 |
Additional information:
- The market return and the risk-free rate averaged 14% and 7% respectively during the year ended 30 June 2022.
- The standard deviation of the market is 10%.
Required:
Evaluate the performance of the three portfolios using:
(i). Sharpe’s performance measure.
(ii). Treynor’s performance measure.
Question 1b
An investor has decided to invest Sh.2,000,000 in the shares of two companies namely Dela Ltd. and Alpha Ltd.
The projections of returns from the shares of the two companies along with their associated probabilities are as
follows:
| Probability | Returns % | |
| Dela Ltd. | Alpha Ltd. | |
| 0.20 | 6 | 8 |
| 0.25 | 7 | 5 |
| 0.25 | -3.5 | 14 |
| 0.30 | 14 | -1 |
Required:
(i) Determine the proportion of each of the above shares required to formulate a minimum risk portfolio.
(ii) The amount (in shillings) that should be invested in each share using the proportions determined in (b) (i)
above.
April 2022
2 Questions
Question 2b
Albert Onchiri, a finance manager at Wema Limited, is considering investing in shares of Safari Airways, a company
quoted at the securities exchange.
The returns on the securities exchange index and Safari Airways shares are shown below for the five possible states
of the economy that might prevail next year:
| Economic condition | Probability | Market return (%) | Safari Airways return (%) |
| Rapid expansion | 0.15 | 25 | 13 |
| Moderate expansion | 0.35 | 20 | 10 |
| No growth | 0.25 | 15 | 8 |
| Moderate contraction | 0.15 | 10 | 4 |
| Serious contraction | 0.10 | 4 | 2 |
Required:
(i). The expected return of Safari Airways shares.
(ii). The correlation between the returns on the securities exchange with the return on Safari Airways shares.
(iii). Comment on the result obtained in (b) (11) above.
(iv). Albert Onchiri is thinking of undertaking an alternative investment but similar to that of Safari Airways’s
shares. If the risk free rate of return is 10%, determine the minimum required rate of return of this
investment,
Question 2a
Examine three practical weaknesses of the arbitrage pricing model (APM) as used in portfolio theory.
Pilot December 2021
1 Questions
Question 2
Arkard, an investment specialist has been entrusted with Sh.10 million by a collective investment scheme (unit trust) and
instructed to invest the money optimally over a two-year period.
Parts of the instruction are that:
1. The funds be invested in one or more of four specified projects and the money market.
2. The four projects are not divisible and cannot be postponed.
3. The unit requires a return of 24% over the two years.
The following are details of the investment in the projects and
the money market.
| Initial Cost Sh.”000” | Return over two years % | Expected Standard deviation of returns over the two years % | |
| Project 1(p1) | 6,000 | 22 | 7 |
| Project 2(p2) | 4,000 | 26 | 9 |
| Project 3(p3) | 6,000 | 28 | 15 |
| Project 4(p4) | 6,000 | 34 | 13 |
| Money market (MM) | 1,000 (minimum) | 18 | 5 |
| The correlation coefficients of returns over the two years are as follows: | |||
| Between Projects | Between projects &market portfolio (MP) | Between projects and the money market (mm) | Between money market and market portfolio |
| P1&p2=0.70 | p1&mp=0.68 | p1&mm=0.40 | MM&MP=0.4 |
| P2&p3=0.0 | p2&mp=0.65 | p2&mm=0.45 | |
| P1&p3=0.62 | p3&mp=0.75 | p3&mm=0.55 | |
| P1&p4=0.56 | p4&mp=0.88 | ||
| P2&p4=0.57 | |||
| P3&p4=0 | |||
Over the two year period, the risk free rate is estimated to be 16%, the market portfolio return is 27% and the variance of the
return on the market 100%.
By analyzing the two assets portfolios:
(a) Use the mean variance dominance rule to evaluate how Arkard should invest the Sh.10 million.
(b) Determine the betas and required rates of return for the portfolios then use the capital assets pricing model to evaluate
how Arkard should invest the Sh.10 million.
(c) Examine four criticisms of the Modigliani and Miller (MM) hypothesis without taxes.
December 2021
1 Questions
Question 2a
Imelda Nasimiyu holds the following portfolio of four risky assets and a deposit in a risk free asset:
| Asset | Portfolio weight (%) | Current return (%) | Beta |
| A | 20 | 12 | 1.5 |
| B | 10 | 18 | 2.0 |
| C | 15 | 14 | 1.2 |
| D | 25 | 8 | 0.9 |
| Risk free asset | 30 | 5 | 0 |
The overall return on the market portfolio of risky assets is 11%.
Required;
(i). Determine the assets that are inefficient, efficient or super efficient using the capital asset pricing model
(CAPM).
(ii) Highlight four weaknesses of using CAPM in (a) (i) above.
September 2021
2 Questions
Question 1b
Softex Limited is contemplating building a 3 - asset portfolio comprising assets of firms A. B and C.
The company wishes to invest Sh.5 million in the shares of these firms. Given below are the number of shares and
the current market prices per share for each company:
| Company | Number of shares | Current market price per share Sh. |
| A | 50,000 | 50 |
| B | 32,500 | 40 |
| C | 40,000 | 30 |
The forecasted market price for each share after one year and their probability of occurrence in different states of
nature are given as follows:
| State of nature | Probability | Forecasted share price after I year (Sh.) Company | ||
| A | B | C | ||
| Boom | 0.30 | 60 | 50 | 36 |
| Normal | 0.40 | 55 | 46 | 34 |
| Reception | 0.30 | 48 | 35 | 27 |
Additional information:
The correlation coefficient of the returns of the assets are given as follows:
| A and B = + 0.98 |
| A and C = + 0.76 |
| B and C = + 1 |
Required:
(i) The expected portfolio return.
(ii) Using the mathematical model, compute the portfolio risk.
Question 1a
Modern portfolio theory applies advanced mathematical models to determine the correlation between risk and
return of investments. While it is commonly used, it does have some potential drawbacks.
In relation to the above statement, examine six shortcomings of the modern portfolio theory.
May 2021
2 Questions
Question 2c
Zachary Mosomi, an investor holds the following portfolio of four risky assets and a deposit in a risk-free asset.
He has provided the information below:
| Asset | Weighting | Current return | Beta |
| A | 20 | 12 | 1.5 |
| B | 10 | 18 | 2.0 |
| C | 15 | 14 | 1.2 |
| D | 25 | 8 | 0.9 |
| Risk-free asset | 30 | 5 | 0 |
The overall return on the market portfolio of risky assets is 11%.
Required:
(i) Portfolio return and beta.
(ii) Using the results in (i) above, deduce the type of investor Zachary is.
(iii) Using suitable computations, determine the assets that are inefficient, efficient or super efficient.
(iv) Calculate the equilibrium return for the portfolio.
Question 2b
The arbitrage pricing theory (APT) and the capital asset pricing model (CAPM) have received much attention from
practitioners and academicians for their use in asset pricing and valuation.
Required:
Explain the difference between APT and the CAPM with respect to:
(i) Investor utility functions.
(ii) Distribution of returns.
(iii) The market portfolio.
November 2020
3 Questions
Question 2a
The following information relates to two mutual funds operating in your country:
| Omega Mutual fund | Beta Mutual fund | |
| Reahsed return | 13% | 18% |
| Beta | 1.0% | 2.0% |
| Standard deviation | 19% | 15% |
Additional information:
1. The return on the market index is 12%.
2 The risk free rate is 8%.
Required:
For each of the above mutual funds, compute the following performance index scores
(i). Jensen's alpha.
(ii). Treynor's alpha.
(iii). Sharpe index for the funds and the market,
Question 2b
The estimated factor sensitivities of Diamond Ltd. to Fama-French factors and the Pastor-Stambaugh model factors and the risk premium associated with those factors are given in the table below:
| Factor sensitivity | Risk premium (%) | |
| Market factor | 1.05 | 5.00 |
| Size factor | -0.65 | 2.50 |
| Value factor | -0.20 | 4.50 |
| Liquidity factor | 0.20 | 4.50 |
| The treasury bill rate is 5% | ||
Required:
(i). The required rate using the Fama-French model.
(ii). The required rate of retumusing the Pastor-Stambaugh model (PSM).
Question 3b
The shareholders of Mali Investment Holdings have for the last two years managed to save an accumulated fund of Sh.15 million available for investment. A financial analyst they hired to appraise some possible projects they can invest in, has availed the following information,
| Project | Initial cash outlay Sh."000" | Expected return (%) | Standard deviation (%) |
| P Q R S | 9,000 7,000 6,000 8,000 | 12 21 16 14 | 2.5 1.8 2.3 1.6 |
The co-variances between various projects contribution are as follows:
| Project pairing | Covariance |
| PQ PR PS QR QS RS | -3.1 1.3 -4.1 1.5 1.7 2.7 |
Additional information:
1. The management is planning to invest by pairing the projects.
2 The maximum capital that can be invested is the accumulated fund as shown above.
3. Any paired project is mutually exclusive and none of the projects is divisible.
Required:
(i) For each possible project pair combination, calculate the expected return, correlation coefficient and standard deviation.
(ii) Advise the shareholders of Mali Investment Holdings on the optimal project pair based on the mean variance criterion.
November 2019
2 Questions
Question 3b
Duncan Kipchumba has an investment capital of Sh.1,000,000. He wishes to invest the fund in two securities, X and Y
in the following proportion; Sh.200,000 in security X and Sh.800,000 in security Y.
The return on these two securities depend on the state of the economy, as shown below:
| State of economy | Probability | Returns on security X | Returns on security Y |
| Boom | 0.40 | 18% | 24% |
| Normal | 0.50 | 14% | 22% |
| Recession | 0.10 | 12% | 21% |
Required:
(i) The expected return on the portfolio.
(ii) The correlation coefficient between security X and security Y.
(iii) The portfolio risk.
(iv) The reduction in risk due to portfolio diversification.
Question 3c
Job Ochieng, an investor, believes that there are three important factors that determine the expected return for a
particular common stock. Job uses the following factor betas and factor risk premiums:
| Factor | Factor beta | Factor risk premium |
| 1 2 3 | 0.70 1.20 -0.10 | 2.5% 5.0% 6.0% |
The risk-free rate is 5%.
Required:
(i) The expected return for the stock using the arbitrage pricing theory (APT) model.
(ii) Explain two differences between capital asset pricing model (CAPM) and arbitrage pricing theory (APT)
model.
May 2019
1 Questions
Question 1a
Discuss four applications of the capital asset pricing model (CAРM).
November 2018
2 Questions
Question 1c
The following data relate to the probability distributions and returns of securities A and B:
| Probability (P) | Security returns (%) | |
| Security A | Security B | |
| 0.10 0.25 0.49 0.25 | -5 10 15 20 | 10 15 10 0 |
Required:
The proportion of each security to be invested in the portfolio in order to attain a zero portfolio risk.
Question 4b
The following information relate to two securities, namely A and B and the market portfolio for the year 2018:
| Probability | Forecasted rate of returns (%) | ||
| Security A | Security В | Market portfolio | |
| 0.20 0.50 0.30 | 15 10 8 | 12 15 10 | 16 12 7 |
The treasury bills yield rate is expected to be 8%.
Required:
(i) The Beta coefficient of securities A and B.
(ii) Using capital asset pricing model (CAPM), determine the minimum required rate of returns for securities
A and B.
May 2018
3 Questions
Question 2c
Kent Investment Fund (KIF) in which you plan to invest has a total capital of Sh.500 million invested in the shares of
five companies as follows:
| Company | Amount invested in shares Sh."million" | Beta coefficient |
| Alpha Ltd. | 140 | 0.8 |
| Beta Ltd. | 80 | 1.5 |
| Chatter Ltd. | 120 | 3.0 |
| Dinner Ltd. | 100 | 1.0 |
| Eastern Ltd. | 60 | 2.5 |
Additional information:
| 1 | The beta coefficient of KIF can be determined as a weighted average of the fund's investment. |
| 2 | The current risk-free rate of return is 8%. |
| 3 | The market returns have the following estimated probability distribution for the next period: Probability Market return (%) 0.1 7 0.2 9 0.4 11 0.2 13 0.1 15 |
Required:
| (i) | The estimated equation of the security market line (SML). |
| (ii) | The fund's required rate of return for the next period. |
| (iii) | Suppose Anthony Muli, the Chief Investment Officer (CIO) of KIF receives a proposal to invest in a new company. The investment needed to take a position in the new company's shares is Sh.50 million. The forecasted rate of return from this investment and the probability of their occurrence in different states of nature, are given as follows: |
| State of Nature | Probability | Forecasted rate of return (%) | |
| A B C D E | 0.1 0.2 0.4 0.2 0.1 | 10 15 20 10 15 |
| Using the capital asset pricing model (CAPM), advise Anthony Muli on whether to invest in the new company's shares. |
Question 2b
A portfolio manager creates the following portfolio:
| Security | Expected annual return (%) | Expected standard deviation (%) |
| 1 2 | 16 12 | 20 20 |
Required:
(i) The proportion invested in Security 1, if the portfolio of the two securities has an expected return of 15%.
(ii) The expected standard deviation of an equal-weighted portfolio, if the correlation of returns between the two securities is -0.15.
(iii) The expected standard deviation of an equal-weighted portfolio, if the returns of the two securities are uncorrelated.
Question 2a
The capital asset pricing model (CAPM) is subject to theoretical and practical limitations. Theoretical limitations are
inherent in the structure of the model, whereas practical limitations arise in implementing the model.
Required:
Summarise two practical limitations of CАРM.
November 2017
1 Questions
Question 2c
Wekeza Investments has initiated an investment fund called "Faidika" the funds of which will be invested only in stocks and bonds of infrastructure and construction companies.
60% of the fund value is invested in companies engaged in commercial construction services and the other 40% in companies engaged in developing residential properties. The average beta of returns from development of residential properties is 1.9 and that of commercial construction services is 1.4.
The benchmark market return is 11.2% while Treasury bonds carry an interest rate of 4.25%.
The following information on the net asset values (NAV) per share is provided:
| Month | January | February | March | April | May | June |
| Closing NAV "Sh" | 18.60 | 17.80 | 18.20 | 18.00 | 17.80 | 16.80 |
| Dividend payout "Sh" | - | 0.75 | - | - | - | 1.20 |
| Month | July | August | September | October | November | December |
| Closing NAV Sh. | 17.20 | 17.80 | 17.90 | 18.10 | 18.80 | 18.50 |
| Dividend payout "Sh" | - | - | - | - | - | - |
The opening NAV for January is Sh.17.75.
Required:
Calculate Jensen's alpha relating to "Faidika" and use it to evaluate the fund's performance.
May 2017
2 Questions
Question 2c
Compare the rankings using the two methods in (b) above and explain two reasons behind the differences.
Question 2b
The following information relates to the performance of six portfolios over a seven-year period:
| Portfolio | Average annual returns(%) | Standard deviation of the average annual returns(%) | Correlation with Market returns |
| P Q R S T U | 18.6 14.8 15.1 22.0 -9.0 26.5 | 27.0 18.0 8.0 21.2 4.0 19.3 | 0.81 0.65 0.98 0.75 0.45 0.63 |
| Market return | 12.0 | 12.0 | |
| Risk-free rate | 9.0 |
Required:
Rank the performance of the above portfolios using:
(i) Sharpe's method.
(ii) Treynor's method.
November 2016
2 Questions
Question 2c
Mary Chege has been investing in the shares of various companies quoted on the securities exchange. Currently, she
holds a portfolio of shares in four companies; W, X, Y and Z.
The following information has been provided:
| Company | Number of shares held | Equity Beta | Market price per share (Sh.) | Expected return on equity |
| W X Y Z | 10,000 15,000 15,000 10,000 | 1.12 0.89 0.70 1.60 | 130 100 90 160 | 18% 23% 11% 17% |
The current market return is 14% per annum and the Treasury Bill's yield is 9% per annum.
Required:
(i) The risk of Mary Chege's portfolio relative to that of the market.
(ii) Determine whether Mary Chege should change the composition of her portfolio.
Question 2b
Moses Mapesa is in the process of evaluating investments in two companies whose percentage returns in the last 10
years are as shown below:
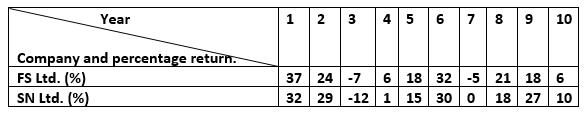
Required:
(i) Correlation coefficient of the companies' returns.
(ii) Portfolio risk assuming equal weighting.
May 2016
2 Questions
Question 2a
Biashara Ltd. wishes to invest in stocks M and N in two different industries. The following information relates to the
two stocks:
| Stock M | Stock N | |
| Expected return (%) | 18 | 16 |
| Standard deviation (%) | 8 | 6 |
| Beta coefficient | 1.80 | 1.50 |
| Amount of money invested (Sh.) | 1,200,000 | 800,000 |
Required:
(i) The expected portfolio return.
(ii) Explain the effect on the portfolio risk if the returns of stocks M and N were perfectly positively correlated.
Include suitable calculations.
Question 2b
Mapeni Ltd's investment fund comprises four major projects. The details of the projects are as follows:
| Project | Market value of the fund (%) | Expected return (%) | Standard deviation (%) | Coefficient of correlation with the market |
| 1 2 3 4 | 28 17 31 14 | 10 18 15 13 | 15 20 14 18 | 0.55 0.75 0.84 0.62 |
The risk-free rate is 5% and the market return is 14%. The standard deviation of the market return is 13%.
Required:
(i) The beta coefficient of the investment fund.
(ii) By comparing the expected return and the required return, advise whether Mapeni Ltd. should change the
composition of its portfolio.
November 2015
4 Questions
Question 2b
In the context of portfolio theory, explain the meaning of "beta coefficient".
Question 2d
The following information relates to portfolios P and N:
| Portfolio P | Portfolio N | |
| Average return | 35% | 28% |
| Beta | 1.25 | 1.00 |
| Standard deviation | 42% | 30% |
| Non-systematic risk | 18% | 10% |
Assume that the risk free rate is 6% and the average market return is 15%.
Required:
(i) Sharpe's performance measure for portfolios P and N.
(ii) Treynor's performance measure for portfolios P and N.
(iii) Jensen's performance measure for portfolios P and N.
(iv) The appraisal ratio for portfolios P and N.
Question 2c
The following data have been provided with respect to three shares traded on the Nairobi Securities Exchange (NSE):
| Share A | Share B | Share C | |
| Risk-free rate of return | 12% | 12% | 12% |
| Beta coefficient | 1.340 | 1.000 | 0.750 |
| Return on the NSE index | 0.185 | 0.185 | 0.185 |
Required:
(i) Interpret the beta coefficients of shares A, B and C.
(ii) Using the capital asset pricing model (CAPM), compute the expected return on shares A, B and C.
Question 2a
In most cases. the assumption is that investors are risk-averse, that is, they like returns and dislike risk.
With reference to the above statement, explain why it is argued that only systematic risk and not total risk is important.
Pilot September 2015
2 Questions
Question 5c
State and explain any three conceptual differences between portfolio theory and the capital asset pricing model
(CAPM).
Question 5b
BC Ltd.'s investment fund comprises of four major projects, details of which are as follows:
| Stock | Number of shares | Market price per share | Expected return (%) | Standard deviation of return | Correlation with the market |
| A | 2,000,000 | 30 | 10 | 15 | 0.55 |
| B | 1,000,000 | 25 | 18 | 20 | -0.75 |
| C | 2,000,000 | 20 | 15 | 14 | 0.84 |
| D | 3,000,000 | 25 | 13 | 18 | -0.62 |
The risk free rate of return is 5% and the probability distribution of a market portfolio return are given as follows:
| Probability | Forecasted return of market |
| % | |
| 0.20 | 0.15 |
| 0.15 | 0.10 |
| 0.30 | 0.15 |
| 0.25 | 0.20 |
| 0.10 | 0.25 |
The variance of return of the market portfolio is 169%.
Required:
(i) Using portfolio theory, evaluate whether this portfolio is super-efficient, efficient or inefficient.
(ii) Using the capital asset pricing model (CAPM), advise whether management of this company should change the
composition of their portfolio or not.