Advanced capital budgeting decision
Unit: Advanced Financial Management
Premium Topic Resources
Sign in to download the full Topic PDF and enable offline revision mode.
Login to Access
Join the community! 550+ students upgraded in the last 24 hours.
Limited Discount Seats Available
Practice CPA Advanced Financial Management Advanced capital budgeting decision questions with detailed answers and explanations.
Access past exam questions by topic, improve your understanding, and download PDF for offline revision.
April 2026
1 Questions
Question 1a
Explain FOUR common capital budgeting pitfalls and briefly illustrate how each may distort investment decision making.
December 2025
2 Questions
Question 1c
Web Limited is negotiating the purchase of a new piece of construction equipment for its current operations. The following information is provided:
1. The equipment would replace an existing equipment which has a current market value of Sh.2,200,000.
The old equipment will be sold if the new one is bought.
2. Purchase of the new equipment would not affect revenues but the before tax operating costs could be reduced by Sh.1,000,000 per annum for five years. The savings would occur at the end of each year.
3. The old equipment is now three years old. It is expected to last for another five years and it is expected to have a resale value of Sh.500,000 at the end of those five years. It was purchased for Sh.4,000,000 and is being depreciated on a straight line basis.
4. The new equipment will also be depreciated on a straight line basis over a period of five years. Web Limited expects to sell the equipment for Sh.1,000,000 at the end of the five years.
5. Corporation tax rate is 30%.
6. Web Limited has profitable ongoing operations.
7. The appropriate discounting rate is 14%.
Required:
Determine the price that Web Limited should offer for the new equipment.
Question 1a
Describe THREE characteristics of real options as used in capital budgeting.
August 2025
2 Questions
Question 1b
Ushindi Ltd. is considering the following projects:
| Project | Initial outlay Sh.“million” | Annual revenue Sh.“million” | Annual fixed costs Sh.“million” | Project life (Years) |
| A | 100 | 200 | 50 | 3 |
| B | 300 | 300 | 100 | 5 |
| C | 150 | 180 | 60 | 4 |
| D | 120 | 170 | 80 | 10 |
| E | 180 | 80 | 20 | 15 |
Additional information:
1. Variable costs are 40% of annual revenue.
2. Each project is divisible.
3. Projects D and E are mutually exclusive.
4. Cash flows are confined within the lifetime of each project.
5. Cost of capital is 10%.
6. Ignore taxation and depreciation.
7. The company has a capital limitation of Sh.400 million for investment.
8. All cash flows occur at anniversary dates.
Required:
(i) Optional allocation of the available capital to the projects.
(ii) Maximum resultant Net Present Value (NPV) from the optimal allocation.
Question 1a
Highlight FOUR reasons for soft capital rationing in a firm.
April 2025
2 Questions
Question 5a
Jawabu Ltd. is a 100% equity financed company. The company is considering undertaking a major diversification in the consumer electronics industry. Its current equity Beta is 1.2, while the average equity Beta (β) of electronics industry is 1.6.
Gearing in the electronics industry averages 30% debt and 70% equity. Corporate debt is considered risk free.
Additional information:
1. Expected return on the market is 25%.
2. The risk-free rate of return is 10%.
3. The corporation tax rate is 30% per annum.
Required:
Using suitable discount rate for the new investment, determine the weighted average cost of capital (WACC) assuming Jawabu Ltd. were to be financed in each of the following ways:
(i) By 20% debt and 80% equity.
(ii) By 30% debt and 70% equity.
Question 1b
As the finance manager of Popo Ltd., the Board has approached you to evaluate the proposed acquisition of
new machinery. The purchase price of the machinery is Sh.100 million. It will cost another Sh.20 million to
modify it for special use. The machine will be sold after 5 years for Sh.40 million and it will require an increase
in net operating working capital (NOWC) of Sh.8 million.
Additional information:
1. The purchase of the new machine will not have any effect on revenues but it is expected to save the
company Sh.45 million per year before tax operating costs mainly labour.
2. The corporate tax rate is 30%.
3. The company uses the straight line method of depreciation.
4. The project cost of capital is 12%.
Required:
(i) Using the net present value (NPV) method, evaluate whether the machinery should be purchased.
(ii) Assume the Board suggests that you conduct a scenario analysis for this project because of the
uncertainties of cost savings, salvage value and net operating working capital. After an extensive
analysis, you come up with the following probabilities and the values for the scenario analysis:
| Scenario | Probability | Before tax savings | Salvage value | Net operating working capital (NOWC) |
| Sh.“million” | Sh.“million” | Sh.“million” | ||
| Worst case | 0.30 | 36 | 32 | 6.4 |
| Base case | 0.40 | 45 | 40 | 8.0 |
| Best case | 0.30 | 54 | 48 | 9.6 |
Required: The project’s expected net present values (ENPV). | ||||
(iii) Analyse THREE common pitfalls that could arise in estimating cash flows in capital budgeting.
December 2024
1 Questions
Question 1c
The directors of Jasiri Ltd. wishes to identify the optimum replacement cycle that will minimise the cost of
operating its fleet of vehicles.
The relevant data is as follows:
| Age of vehicles (years) | 0 | 1 | 2 | 3 | 4 |
| Sh.“000” | Sh.“000” | Sh.“000” | Sh.“000” | Sh.“000” | |
| Replacement cost | 7,000 | - | - | - | - |
| Annual operating and maintenance cost | 500 | 750 | 1,000 | 2,000 | |
| Residual value at the end of the year | 4,750 | 3,500 | 3,000 | 2,250 |
Additional information:
- The company’s cost of capital is 10%.
- Ignore taxation.
Required:
Using the annual equivalent cost (AEC) technique, advise Jasiri Ltd. on the best time to replace the vehicles.
August 2024
3 Questions
Question 1c
Mavuno Bora Ltd. is an agro-based company incorporated in Kenya. The company intends to invest in a capital
project which will be based in Cape Town, South Africa.
Additional information:
| 1. | The project will commence on 1 January 2025 with the initial capital of 5 million South Africa Rands (ZAR) which will be used in acquiring agricultural machinery with an estimated useful life of 5 years with a zero salvage value. The straight line method of depreciation will be applied. |
| 2. | To enable the firm pay land rates and other working capital requirements, an additional 2.5 million ZAR will be required and it is expected that this amount will be recouped in full at the end of the project’s useful life. |
| 3. | Annual sales revenue from the project are estimated as follows: | ||
| Year | Revenue (ZAR) | Fixed costs (ZAR) | |
| 2025 | 2,600,000 | 600,000 | |
| 2026 | 3,500,000 | 780,000 | |
| 2027 | 5,000,000 | 905,000 | |
| 2028 | 4,200,000 | 880,000 | |
| 2029 | 2,800,000 | 450,000 | |
| 4. | Variable operating costs are expected to be 20% of the sales and are assumed to accrue evenly. |
| 5. | The exchange rates between the Kenya Shilling and the South Africa Rand are as follows: |
| ZAR/KES | ||
| 1 January 2025 | 8.00 | |
| 31 December 2025 | 8.50 | |
| 31 December 2026 | 9.00 | |
| 31 December 2027 | 9.50 | |
| 31 December 2028 | 10.00 | |
| 31 December 2029 | 10.30 | |
| 6. | All the cash flows are expected to occur at the year end. | |
| 7. | The cost of capital for both South Africa and Kenya is assumed to be 12% per annum. | |
| 8. | Assume that the corporation tax rate in South Africa is 30% and no further taxation will be levied in Kenya. | |
| Required: | ||
| (i) | The net present value (NPV) of the project in Kenya Shillings (KSh.). | |
| (ii) | Based on your results in (c) (i) above, advise the management of Mavuno Bora Ltd. on appropriate course of action. | |
Question 1b
A company is considering two mutually exclusive projects namely; project A and project B. The company uses
the certainty equivalent approach to evaluate capital projects. The estimated cash flows and certainty equivalents
for each project are as follows:
| Year | Project A | Project B | ||
| Cash flows Sh.“000” | Certainty equivalents Sh.“000” | Cash flows Sh.“000” | Certainty equivalents Sh.“000” | |
| 0 | (45,000) | 1.00 | (60,000) | 1.00 |
| 1 | 22,500 | 0.85 | 37,500 | 0.80 |
| 2 | 22,500 | 0.80 | 30,000 | 0.70 |
| 3 | 15,000 | 0.75 | 22,500 | 0.60 |
| 4 | 15,000 | 0.60 | 15,000 | 0.50 |
The risk free rate is 5%.
Required:
Advise the company on which project to undertake using the certainty equivalent method.
Question 5b
Ujezi Ltd., a property development company, has gained planning permission for the development of a housing
complex at Mua Greens Estate which will be developed over a three-year period.
The resulting property sales less building costs have an expected net present value of Sh.4,000,000 with a cost of
capital of 10% per annum. Ujezi Ltd. has an option to acquire land in Mua Greens Estate at an agreed price of
Sh.24,000,000 which must be exercised within the next two years.
Immediate building of the housing complex would be risky as the project has a volatility attaching to its net
present value of 25%.
One source of risk is the potential for development of Mua Greens Estate as a regional commercial centre for the
large number of firms leaving the capital, because of high rents and local business taxes. Within the next two
years, an announcement by the government will be made about the development of transport links into Mua
Greens Estate from the outlying areas including the area where Ujezi Ltd. hold the land option.
The risk free rate of interest is 5% per annum.
Required:
| (i) | Estimate the value of the option to delay the start of the project for two years using the Black Scholes Option Pricing Model (BSOPM) and comment on your findings. Assume that the government will make its announcement about the potential transport link at the end of the two years. |
| (ii) | On the basis of valuation of the option to delay, estimate the overall value of the project, giving a concise rationale for the valuation method used. |
| (iii) | Explain TWO other types of real options that may be present relating to the Mua Greens Estate housing development. Hint: Value of call option: \(P_s (Nd_1)\) – \(P_e (Nd_2). e^{–rfT}\) Where: \(\displaystyle d_1 = \frac{ln (P_s/P_e) + (rf + 0.5σ^2)T}{σ \sqrt{T}}\) \(d_2 = d_1 – σ \sqrt{T}\) \(P_s\)\(=\)Underlying price \(P_e\) \(=\)Strike price σ \(=\)Volatility rf \(=\) Continuity compounded risk-free interest rate T = Time to expiration |
April 2024
2 Questions
Question 1a
Summarise FOUR causes of hard capital rationing as used in capital budgeting.
Question 1c
Kangaro Youth Sports Ltd. wishes to design a new sports bicycle. The company will have to invest Sh.100 million at the beginning of the first year for the design and model testing of the new bicycle.
The firm’s managers believe that there is an 80% probability that this phase will be successful and the project will continue.
If Phase 1 is not successful, the project will be abandoned with zero salvage value.
The next phase, if undertaken, would consist of making the molds and producing twenty prototype bicycles. This would cost Sh.400 million at the end of the first year. If this phase is successful, the firm would go into full scale production. If the phase is not successful, the molds and prototypes could be sold for Sh.150 million. The managers estimate that the probability that the bicycles will pass the test is 90% and that Phase 3 will be undertaken.
Phase 3 consists of changing over current production line to produce the new design. This would cost Sh.1,100 million in year 2.
If the economy is strong at this point, the net value of cash flows would be Sh.3,500 million, while if the economy is weak the net value of cash inflows would be Sh.2,600 million. Both net values of cash inflows will be realised at the end of year 3 and both states of the economy are equally likely.
The company’s cost of capital is 13%.
Required:
(i) Using a decision tree, determine the project’s expected net present value (ENPV).
(ii) Calculate the project’s standard deviation of expected net present value and comment on the result.
(iii) Using the normal probability distribution, compute the probability that the project’s net present value will be at least Sh.80 million.
August 2023
2 Questions
Question 5b
Mapato Ltd. has the following capital structure which it considers optimal:
| Debentures | 25% |
| Preference share capita | 15% |
| Ordinary share capital | 60% |
| 100% |
Additional information:
| 1. | Mapato Ltd.’s expected profit after tax for the year ended 30 June 2023 was Sh.34,285,714. Mapato Ltd. has an established dividend pay-out ratio of 30%. The tax rate for the company is 30% and investors expect earnings and dividends to grow at a constant rate of 9% per annum in the future. |
| 2. | The company paid a dividend of Sh.3.6 per share in the year ended 30 June 2023. The company’s shares currently sells at Sh.60 per share. |
| 3. | The company can obtain new capital as follows: | |
| Ordinary shares: | New ordinary share capital can be issued at a floatation cost of 10%. | |
| Preference share capital: | New preference share capital can be issued to the public at Sh.100 per share. The floatation cost is Sh.5 per share and a dividend of Sh.11 per share. | |
| Debentures: | Debentures can be issued at an interest rate of 12% per annum. | |
| 4. | Assume that the cost of capital is constant beyond the retained earnings breakpoint. |
| 5. | Mapato Ltd. has the following investment opportunities: |
| 5. | Project | Cost (Sh.) | Internal rate of return (IRR) |
| A | 10,000,000 | 17.4% | |
| B | 20,000,000 | 16.0% | |
| C | 10,000,000 | 14.2% | |
| D | 20,000,000 | 13.7% | |
| E | 10,000,000 | 12.0% |
Required:
(i) Calculate the break point in the marginal cost of capital (MCC) schedule.
(ii) Determine the cost of each capital structure component.
(iii) Calculate the weighted average cost of capital (WACC) in the intervals between the break points in the
marginal cost of capital (MCC) schedule.
(iv) Using the marginal cost of capital schedule, identify the projects that the company should accept and
why.
Question 2b
Tobin Ltd. is appraising an investment project which has a cost of Sh.20 million payable in full at the start of the
first year of operation. The project life is expected to be four years. Forecast sales, volumes, selling prices,
variable costs and fixed costs are as follows:
| Year | 1 | 2 | 3 | 4 |
| Sales (units per year) | 300,000 | 410,000 | 525,000 | 220,000 |
| Selling price per unit (Sh.) | 125 | 130 | 140 | 120 |
| Variable cost per unit (Sh.) | 71 | 71 | 71 | 71 |
| Annual fixed cost (Sh.“000”) | 3,000 | 3,100 | 3,200 | 3,000 |
Additional information:
- Selling price and cost information are in current price terms before applying selling price inflation of 5% per year, variable cost inflation of 3.5% per year and fixed cost inflation of 6% per year.
- Tobin Ltd. pays annual corporation tax of 30%, with the tax liability being settled in the year in which it arises.
- The company can claim tax allowable depreciation on the full initial investment of Sh.20 million on a 25% straight line basis.
- The company’s investment project is expected to have zero residual value at the end of four years.
- Tobin Ltd. has a nominal after tax cost of capital of 12% and a real after tax cost of capital of 8%.
- The general rate of inflation is expected to be 3.7% per year for the foreseeable future.
Required:
The nominal net present value (NPV) of Tobin Ltd.’s investment project.
April 2023
1 Questions
Question 1c
XYZ Limited is considering six investment projects with the following details:
| Project | Initial outlay Sh. “000” | Net present value Sh. “000” |
| 1 | 1,000 | 390 |
| 2 | 750 | 325 |
| 3 | 1,125 | 590 |
| 4 | 1,850 | 840 |
| 5 | 1,300 | 635 |
| 6 | 1,500 | - |
Additional information:
| 1. | Project 6 is expected to generate the following annual cash flows: |
| 1. | Year | 1 Sh. “000” | 2 Sh. “000” | 3 Sh. “000” | 4 Sh. “000” |
| Sales | 725 | 765 | 885 | 612 | |
| Cost | 145 | 168 | 202 | 94 |
| Project 6 cash flows are exclusive of inflation at the rate of 4% per year for sales income and 5% per year for costs. | |
| 2. | The cost of capital is 10%. |
| 3. | Due to management reluctance to raise additional finance, the capital for investment is currently restricted to Sh.5,000,000. |
| 4. | Project 1, 3, 5 and 6 are all independent but project 2 and 4 are mutually exclusive. |
| 5. | All of the above projects are divisible and none can be delayed or repeated. |
Required: | |
| (i) | The net present value (NPV) for project 6. |
| (ii) | The optimum investment combination given the capital constraint. |
| (iii) | The resulting net present value (NPV) in (c) (ii) above. |
December 2022
2 Questions
Question 1a
(i) Explain the term “real option” as used in capital investment appraisal.
(ii) Evaluate THREE types of real options.
Question 1b
The management of College Publishers Ltd. has estimated the following initial cash outlays and net cash flows
and probabilities for a new printing process in each case scenario:
| Year | Worst case Sh.“000” | Most probable case Sh.“000” | Best case Sh.“000” |
| 0 | (100,000) | (100,000) | (100,000) |
| 1 | 20,000 | 30,000 | 40,000 |
| 2 | 20,000 | 30,000 | 40,000 |
| 3 | 20,000 | 30,000 | 40,000 |
| 4 | 20,000 | 30,000 | 40,000 |
| 5 | 20,000 | 30,000 | 40,000 |
| \(5^*\) | 5,000 | 20,000 | 30,000 |
| Probability | 0.20 | 0.60 | 0.20 |
Year 0 is the initial cost of the new printing process, years 1 – 5 are the operating net cash flows and year 5* is the
estimated salvage value. The firm’s cost of capital for a project of average risk is 13% per annum.
Required:
(i) Assuming that the above project has an average risk, compute the expected net present value (ENPV) of
the project.
(ii) A sensitivity analysis of the salvage value if this variable changes from the base case value by + (plus or
minus) 80%.
(iii) Assume that all cash flows are positive perfectly correlated and that there are only three possible cash
flow scenarios over time namely; worst case, most probable case and best case with probabilities of 0.2,
0.6 and 0.2 respectively.
Determine the project’s standard deviation of the net present value (NPV).
August 2022
2 Questions
Question 4c
Ngao Ltd. is considering investing in two capital investment projects; X and Y. The projects cash flows are
provided as shown below:
| Project | ||
| Year | X | Y |
| Cash flow Sh.“000” | Cash flow Sh.“000” | |
| 0 | (40,000) | (80,000) |
| 1 | (80,000) | (40,000) |
| 2 | (120,000) | - |
| 3 | 400,000 | 240,000 |
The funds available for investment in both projects are restricted as follows:
| Year | Amount Sh.“000” |
| 0 | 100,000 |
| 1 | 80,000 |
| 2 | 60,000 |
Additional information:
- None of the projects will delay, that is, both investments will start in year 0.
- The funds not utilised in one year shall not be available for investment in the subsequent years.
- Both projects are divisible, that is, a project can be undertaken in part or in whole.
- The cost of capital is 13%.
Required:
(i) Formulate a linear programming model to solve the problem.
(ii) Using the graphical approach, solve the linear programming model and hence determine the proportion
of each project to be undertaken to maximise net present value (NPV).
Question 1a
A project requires an initial investment of Sh.500,000. It is expected to generate cash inflows of Sh.200,000 per annum for the next 5 years.
Additional information:
- The firm is indifferent between a certain amount of Sh.181,347 at the end of the first year and the expected amount of Sh.200,000.
- The risk free rate of return is 5% per annum.
Required:
(i) The net present value (NPV) of the project incorporating certainty equivalent coefficient (CEC).
(ii) Advise the management on whether the project is worthwhile.
April 2022
2 Questions
Question 5b
Popo Ltd. is considering a project requiring an initial cash outlay of Sh.150 million. The project’s life is five years
after which there would be no expected salvage value. The possible incremental after tax cash inflows and associated
probabilities of occurrence are as follows:
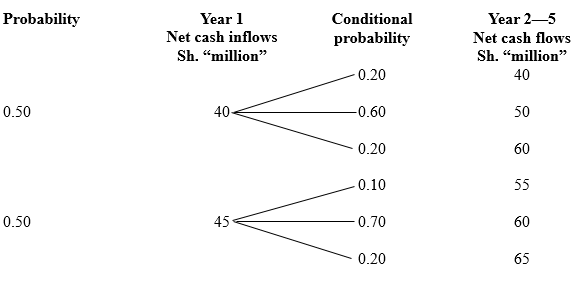
The company’s required rate of return for this investment is 12%.
Required:
(i) Using decision tree analysis, compute the Expected Net Present Value (ENPV) of the project.
(ii)
Compute the standard deviation of the Expected Net Present Value in (b) (i) above.
Question 1a
Treetop Limited is considering an investment project in the tourism industry worth Sh.48 million which will be a diversification from the mainstream activities.
The Sh.48 million project cost will be financed as follows: Sh.10 million using internal funds; Sh.20 million using a rights issue and Sh. 18 million with long-term loans.
The investment is expected to generate pretas net cash inflows of approximately Sh.14 million per year for a period of 10 years. The residual value at the end of the 10 year period will be Sh.15 million after taxes. As the investment is in an area where the government wishes to develop, a subsidised loan of Sh.8 million out of the total Sh. 18 million is available. This will cost 2% below the company's normal cost of long-term debt finance which is 8%
Additional information:
- The company's equity beta is 0.85 and its financial gearing is 60% equity and 40% debt by value.
- The average equity beta in the tourism industry is 1.2, and average gearing is 50% equity and 50% debt by market value.
- The risk free care is 5.5% per annom
- The market return is 12% per annum.
- Issue costs are estimated to be 1% of debt financing (excluding the subsidised loan) and 4% for equity financing. These costs are not tax allowable.
- The corporate tax rate is 30%
Required:
(i) The adjusted present value (APV) of the proposed investment project.
(ii) Propose three circumstances under which the APV may be preferred to the net present value (NPV) approach as a method of evaluating a capital investnem project.
Pilot December 2021
2 Questions
Question 4b
Rhinox LTD is planning to invest in an expansion plan. The company has estimated Sh.20 million as the initial investment for the expansion.
The plan is expected to generate Sh.5 million annual after tax cash inflow for the next 5 years. Cost of capital is 10%.
Required:
(i) The NPV of the project.
(ii) The value of the call option to delay if the risk free rate of return is 7% and standard deviation of returns is 30%.
Question 3
An investor is considering introducing a new product code named super pad into the market. This would involve purchasing a plant costing Sh.300 million. Additional information:
| 1. | The plant has a useful life of five years and is to be depreciated on a straight line basis. |
| 2. | The salvage value is nil. |
| 3. | Due to market uncertainties, the sale price, variable cost and sales volume of the super pad have been estimated stochastically as follows: |
| Selling price | Variable Cost | Sales Volume | ||||
| Value Sh. | Probability | Value Sh. | Probability | Value units | Probability | |
| 30 | 0.20 | 10 | 0.20 | 4 million | 0.20 | |
| 40 | 0.60 | 20 | 0.50 | 6 million | 0.50 | |
| 50 | 0.20 | 30 | 0.30 | 8 million | 0.30 | |
| 4. | The company’s cost of capital is 12% and the corporate tax rate is 30%. | |||||
| Required: | |
| (a) | The expected net present value (NPV) of the new product using expected values for each variable. |
| (b) | The expected NPV by performing ten runs using the following random numbers for each variable. Selling.price:...76..64..02..53..16..16..55..54..23..36 Variable.cost:..20..82..74..08..01..69..36..35..52..99 Sales.volume:.55..50..29..58..51..14..86..24..39..47 Required: Determine the expected NPV as simulated. |
| (c) | The probability that this product will be a success. |
| (d) | Discuss the advantage (merits) and disadvantages (limitations) of simulation analysis. |
December 2021
2 Questions
Question 5b
Due to restrictions in the capital markets, Rahim Ltd.'s financial manager is able to provide only Sh.900 million
for investments in the next financial year.
An analysis of the project's allowable for investment during the next financial year shows the following expected
net present values (ENPV) for each project:
| Project | Initial investment Sh. (millions) | Net present value Sh. (millions) |
| P | 300 | 120 |
| Q | 300 | 90 |
| R | 600 | 150 |
| S | 300 | 30 |
| T | 150 | 12 |
Project Q and R are mutually exclusive.
Required:
Advise the management on the project(s) to undertake.
Question 5a
An investor is considering introducing new classic pens into the market. The firm is contemplating investing in
purchase of a new plant costing Sh.250 million. The plant has a useful life of five years and is to be depreciated to
zero on a straight line basis.
Due to market uncertainties, selling price per unit, unit variable cost and annual sales volume of the new classic
pens have been estimated stochastically as follows:
| Unit selling price | Unit variable cost | Annual sales volume | |||
| Value | Probability | Value | Probability | Volume | Probability |
| 25 | 0.30 | 10 | 0.20 | 4.5 million | 0.30 |
| 35 | 0.50 | 15 | 0.40 | 6 million | 0.40 |
| 45 | 0.20 | 30 | 0.40 | 7.5 million | 0.30 |
The firm will incur annual fixed operating costs excluding depreciation of Sh.20 million. The company's cost of
capital is 10% and corporation tax rate applicable is 30%.
Required:
| (i) | The expected net present value (NPV) of the project. |
| (ii) | Simulate the net present value (NPV) using the following random numbers: (752560 658055 957530 869950 544025) and hence determine the expected Net Present Value of the project. |
| (iii) | Determine the probability that the product will be a success. |
September 2021
2 Questions
Question 4b
Dinosoft Limited's capital structure, which it considers optimal, is given as follows:
| Sh."million" | |
| Debenture capital | 25 |
| Reserves | 15 |
| Ordinary share capital | 45 |
| Preference share capital | 15 |
| 100 |
Additional information:
| 1. | The firm's historical earnings per share (EPS) and dividend per share (DPS) over the last five years are given as follows: |
| Year to 31 December | EPS Sh. | DPS Sh. | |
| 2016 | 6.5 | 3.00 | |
| 2017 | 6.8 | 3.10 | |
| 2018 | 7.0 | 3.30 | |
| 2019 | 7.5 | 3.50 | |
| 2020 | 8.0 | 3.60 |
| 2. | The company's ordinary shares currently sell at Sh.50 per share at the Securities Exchange. New ordinary shares will be sold at this price. |
| 3. | The company's expected net income for the year ending 31 December 2020 is Sh.40,000,000. Dinosoft Limited adopts a constant payout ratio of 40% as its dividend policy. |
| 4. | The company can raise additional capital as follows to finance acceptable investment projects: | |
| Equity capital: | Utilise all available retained earnings for the year ended 31 December 2020. Any extra external equity will be raised through issue of new ordinary shares at a floatation cost of 10% of the issue price. | |
| Preference share capital: | New preference shares will be issued at 11% coupon rate. The par value of each share is Sh.100. New preference shares will be issued at par subject to a floatation cost of Sh.5 per share | |
| Debentures: | New debentures can be sold at a coupon rate of 13%. The debentures will be issued at par. | |
| 5. | Corporation tax rate is 30%. | |
| Required: | |
| (i) | Calculate the breakpoint in the marginal cost of capital schedule. |
| (ii) | The weighted marginal cost of capital (WMCC) in each of the intervals between the breakpoints. |
| (iii) | Dinosoft Limited has the following potential investment opportunities. | ||
| Project | Initial cash outlay Sh. | Internal rate of return (%) | |
| V | 10,000,000 | 16 | |
| W | 20,000,000 | 14 | |
| X | 10,000,000 | 11 | |
| Y | 20,000,000 | 10 | |
| Z | 10,000,000 | 8 | |
| (iii) | Required: Using the investment opportunities schedule, advise on which project(s) to accept and hence determine the firm's optimal capital budget. |
Question 3a
XYZ Ltd. is considering buying a new machine for its manufacturing processes at a cost of Sh.10 million. The
machine is expected to have a useful life of 2 years with no salvage value. The future net cash flows to be
generated in each year are uncertain. The estimated cash flows and probability of their occurrence are given as
follows:
Additional information:
- The possibility of abandonment exists after 1 year.
- The abandonment value is estimated at Sh.8 million.
- The cost of capital is 13%.
Required:
(i) Expected net present value of the project. Ignore the abandonment option.
(ii) Using suitable computations, justify whether abandonment of the project is a viable option.
(iii) Determine the expected net present value (ENPV) of the project assuming it is advantageous to abandon
the project after I year. Comment on the financial implications to the firm.
May 2021
2 Questions
Question 5c
Zedtech Ltd. wishes to design a new product so as to catch the interest of their target market which is currently very competitive.
The company will have to invest Sh.100,000 at the beginning of the first year (year 0) for the design and model testing of the new product.
The company's marketing manager believes that there is an 80% chance that this phase will be successful and the project will continue. If phase 1 is not successful, the project will be abandoned with zero salvage value.
The next phase, if undertaken would consist of making the moulds and producing ten prototype products at a cost of Sh.500,000 at the end of the first year. If the'products test well, the company would go into full scale production. If they do not, the moulds and prototypes will all be sold for Sh.400,000. The manager estimates that there is a 90%
probability that the products will pass testing and phase 3 will be undertaken.
Phase 3 consists of changing over the firm's current production line so as to be able to produce the new products. This will cost Sh.1,000,000 at the end of year 2. If the economic conditions are favourable at this juncture, the net value of the firm's cash flows are estimated to be Sh.3,500,000, while if the economic conditions are unfavourable the net cash inflows are estimated at Sh.2,500,000. Both net cash flows are expected at the end of year 3, and the two states of economy are equally likely.
The firm's opportunity cost of capital is 11%.
Required:
(i) Construct a decision tree to depict payoffs, and hence determine the expected net present value (NPV) of the project.
(ii) The project's expected standard deviation and coefficient of variation.
(iii) Assuming the firm's average project had a coefficient of variation of between 1.0 and 2.0, explain whether the project would be of high, low or average risk.
Question 1b
You have been appointed by Biosoft Limited to review three investment project proposals. The investment funds are
limited to Sh.8.000,000 in the current financial year. Details of the three possible investment projects. none of which
can be delayed are given below:
Project 1: An investment of Sh.3,000,000 in workstation assessments. Each assessment would be on an individual
employee basis and would lead to a saving in labour costs from increased efficiency and reduced absenteeism. In
money terms, the savings in labour costs are expected to be as follows:
| Year | 1 | 2 | 3 | 4 | 5 |
| Cash Flow (Sh. "000") | 850 | 900 | 950 | 1,000 | 950 |
Project 2: An investment of Sh.4,500,000 in individual workstations for staff that is expected to reduce
administration costs by Sh.1,408.000 per annum in money terms for the next five years.
Project 3: An investment of Sh.4,500,000 in new ticket machines. A net cash savings of Sh.1,200,000 per annum is
expected in current money terms and is projected to increase by 3.6% per annum due to inflation during the five years
life of the machines.
The money cost of capital for Biosoft Limited is 12%.
Required:
Advise the company on the project(s) to invest the available funds and calculate the resultant net present value (NPV)
assuming:
(i) The three projects are divisible.
(ii) None of the projects is divisible.
November 2020
2 Questions
Question 4c
Describe four types of real options available to the management while making strategie capital budgeting decisions of a firm.
Question 1c
Chanzu Ltd. is considering a project which would cost Sh.5,000,000 now. The annual benefits for four years, would be a fixed income of Sh.2,500,000 per annum plus other savings of Sh.500,000 in year 1. rising by 5% each year because of inflation. Running costs will be Sh. 1,000,000 in the first year but would increase at a rate of 10% each year because of inflating labour costs.
The general rate of inflation is expected to be 7.5% per annum and the firm's required nominal rate of return is 16%.
Required:
(i). Advise the management of Chanzu Limited on whether to undertake the project.
(ii). Comment on the impact of inflation in (c) (i) above.
November 2019
3 Questions
Question 1b
Sunny Technologies Ltd. is' considering investing Sh.50 million in a new machine to manufacture computer micro
chips with an expected useful life of 5 years and no salvage value. It is expected that 20 million units of micro chips
will be sold each year at Sh.3.00 per unit. Variable production costs are expected to be Sh.1.65 per unit, while
incremental fixed costs will be Sh.10 million per annum.
The cost of capital is 12%.
Required:
Evaluate the sensitivity of the project's net present value (NPV) to the following changes:
(i) Sales volume.
(ii) Sales price.
(iii) Variable costs.
Question 1c
Further analysis of the company in (b) above suggests that sales volumes could depend on expected economic state as
follows:
| Economic state | Poor | Normal | Good |
| Probability | 0.30 | 0.60 | 0.10 |
| Annual sales volume (units) | 17,500,000 | 20,000,000 | 22,500,000 |
Required
The expected net present value (NPV) of the project using scenario analysis
Question 2a
Kanga Limited is considering the design of a new conveyor system. The management must choose among the following three alternative courses of action:
Option 1
The firm could sell the design outright to another corporation with payments over 2 years.
Option 2
The firm could license the design to another manufacturer for a period of 5 years which is likely to be the product life cycle of the conveyor system.
Option 3
The company could manufacture and market the system itself. This alternative will result in 6 years of cash inflows.
Cash flows associated with each alternative are as shown below:
| Alternative | Sell | License | Manufacture |
| Initial investment, I, (Sh.) | 400,000 | 400,000 | 900,000 |
| Year | Cash inflows (Sh.) | ||
| 1 2 3 4 5 6 | 400,000 500,000 - - - - | 300,000 200,000 160,000 120,000 80,000 - | 400,000 500,000 400,000 400,000 400,000 400,000 |
The company has a cost of capital of 12%.
Required:
Advise Kanga Limited on the best alternative based on:
(i) Net present value (NPV) approach.
(ii) Annualised net present value (ANPV) approach.
(iii) Compare and contrast your results obtained in (a) (i) and (ii) above.
May 2019
1 Questions
Question 5a
Jeza Tours and Travel is a private limited company in the tourism industry. In order to improve customer service and provide the management with timely and quality information, the company is contemplating to purchase 8 micro-computers at a cost of Sh. 100,000 cach.
Installation cost for all the computers will amount to Sh.80,000. It is estimated that once installed, the computers will increase the company's carnings before depreciation and tax from Sh. 12,000.000 to Sh.12,500,000 annually.
The computers are expected to last for 10 years after which they will be obsolete with no resale value.
The Operations Manager proposes that the computers will be useful for 15 years with no resale value.
The Marketing Manager, on the other hand argues that the company needs the computers for only 5 years, after which they can be disposed of at Sh. 50,000 each.
The probability distribution of the useful life of the computers is given as follows:
| Probability | Useful life of computers (years) |
| 0.20 0.50 0.30 | 5 10 15 |
The company is in the 30% tax bracket.
The company's cost of capital is 24% and uses the straight-line method of depreciation.
Requíred:
(i). The expected net present value of the project.
(ii). The standard deviation of the expected net present value.
(iii). If the net present value (NPV) of the project is less than Sh.200,000, the firm will be exposed to a financial distress. Determine the probability that the firm will avoid financial distress. (Assume normal distribution).
November 2018
2 Questions
Question 2a
Discuss three practical challenges that could be encountered when making capital investment decisions.
Question 2b
Galanema Ltd. is considering to introduce new cheap plastic rulers into the market. This will involve investing in
a new plant at a cost of Sh.280 million.
Additional information:
The plant is expected to have a useful life of 5 years at the end of which salvage value will be nil. The firm's
policy is to depreciate all of its fixed assets on astraight line basis.
Due to market uncertainties, the unit selling price, unit variable cost and annual sales volume of the new plastic
rulers have been estimated stochastically as follows:
| Unit selling price | Unit variable cost | Annual sales volume | |||
| Value Sh. | Probability | Value Sh. | Probability | Value (Sh."million") | Probability |
| 35 30 50 | 0.30 0.40 0.30 | 15 10 25 | 0.20 0.50 0.30 | 4 7 9 | 0.10 0.60 0.30 |
Additional information:
1. The firm expects to incur fixed operating costs excluding depreciation of Sh.30 million in each year.
2. The company's cost of capital is 17%.
3. The corporate tax rate is 30%.
Required:
| (i) | The expected net present value (NPV) of the new product. |
| (ii) | Simulate the net present values (NPV) using the following random numbers: (802560 638351 057530 150353 603785 553525 245239 369948 160252 857015) and compute the expected net present value of the project. |
May 2018
2 Questions
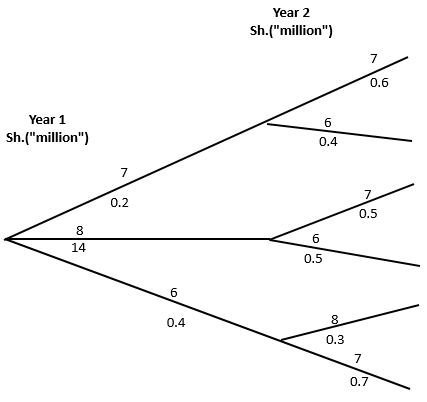
Question 1b
In relation to investment appraisal, evaluate four limitations of sensitivity analysis.
Question 1c
Tabby Ltd. has a potential investment opportunity for which the initial cash outlay and future cash flows are uncertain.
The analysis carried out provided the following probability estimates:
| Probability estimates | |||
| Cash outlay | Annual cash inflows | ||
| Probability | Amount Sh."000" | Probability | Amount Sh."000" |
| 0.45 | 250,000 | 0.20 | 45,000 |
| 0.25 | 280,000 | ||
| 0.40 | 50,000 | ||
| 0.25 | 300,000 | ||
| 0.10 | 305,000 | 0.40 | 60,000 |
Additional information:
1. The cost of capital is 10%.
2 Life of the project is expected to be 10 years.
3. The salvage value is zero.
Required:
(i) Construct a decision tree for the investment to show pay offs, probabilities and net present value (NPV) for
each alternative.
(ii) The expected NPV of the project.
(iii) If the NPV of the project is less than Sh.5 million, Tabby Ltd. would be exposed to a hostile takeover.
Compute the probability that Tabby Ltd. will avoid a hostile takeover. (Assume a normal distribution and that the variance of the NPV is Sh.1,861.47 million).
November 2017
1 Questions
Question 1b
Viwanda Ltd. is considering purchasing a machine at a cost of Sh.40 million. The company will incur an additional
Sh.20 million to modify the machine for special use.
The machine is expected to have a useful life of 3 years and a scrap value of Sh.15 million after 3 years.
This investment will require an increase in net working capital of Sh.2 million at the beginning of its useful life.
The additional investment in working capital will return to normal at the end of the machine's useful life.
The machine's purchase will not affect revenues but it is expected to save the company Sh.25 million each year in
before tax operating costs, mainly labour.
The corporation tax rate is 30% and the company's cost of capital is 10%.
Required:
(i). Advise Viwanda Ltd. on whether to buy the machine.
(ii). Suppose the firm's management is unsure about the savings in before tax operating costs. Carry out a sensitivity analysis on this variable assuming that the variable shall vary adversely by 10%.
May 2017
2 Questions
Question 5b
Chuma Ltd. operates a machine which has the following maintenance costs and resale values over its four-year life.
The purchase price of the machine is Sh.25,000,000.
| Year 1 Sh."000" | Year 2 Sh."000" | Year 3 Sh."000" | Year 4 Sh."000" | |
| Maintenance costs | 7,500 | 11,000 | 12,500 | 15,000 |
| Resale value (end of year) | 15,000 | 10,000 | 7,500 | 2,500 |
The company's cost of capital is 10%.
Required:
Advise the management of Chuma Ltd. on how frequently the machine should be replaced.
Question 1b
Kenzel Ltd. has the following capital structure which it considers optimal under both the present and forecasted conditions:
| Source of capitai | % |
| Long-term debt Equity capital | 45 55 |
| Total | 100 |
The management of Kenzel Ltd. forecasts the after-tax earnings for the forthcoming year at Sh.2.5 million. The
company has been paying 60 per cent of its earnings as dividend and this payment ratio is expected to continue nto
the foreseeable future. The company's present loan commitment will allow it to incur additional leverage according to
the schedule presented below:
| Loan amount (Sh.) | Interest rate on incremental debt |
| 0-500,000 | 9% |
| 500,000 - 900,000 | 11% |
| 900,000 and above | 13% |
The company's corporate tax rate is 30%. The current market price of the equity shares ofthe company is Sh.22. The
last dividend on equity shares was paid at Sh.2.20 per share and the expected growth rate is 5%. New equity shares
can be sold at a floatation cost of 10% ofthe issue price.
Kenzel Ltd. has the following investment opportunities for the coming year:
| Project | Cash outlay Sh. | Annual net cash flow Sh. | Project life (years) Sh. | Internal rate of return % |
| A B C D E | 675,000 900,000 375,000 562,500 750,000 | 155,401 268,484 161,524 185,194 127,351 | 8 5 3 4 10 | ? 15 ? 12 11 |
Required:
(i) The amounts in shillings at which breaks in the marginal cost of capital (MCC) schedule occur.
(ii) The weighted marginal cost of capital (WMCC) in each of the intervals between the breaks in the MСС
schedule.
(iii) The internal rate of return (IRR) for project A and project C.
(iv) Using the investment opportunities schedule (IOS), advise on which project(s) should be accepted.
November 2016
2 Questions
Question 2a
Explain three challenges likely to be encountered in the application of the capital asset pricing model (CAРM).
Question 1b
SKB Ltd. is considering a proposal to manufacture a new drug named "Millenium". The drug will be manufactured
using a machine which will cost Sh.13 million.
The cash flows and drug life relating to "Millenium" have been estimated as stochastic exogenous variables with the
following distributions:
| Annual after tax cash flow (Sh."000") | Probability | Drug life in years | Probability |
| 1,000 1,500 2,000 2,500 3,000 3,500 4,000 | 0.02 0.03 0.15 0.15 0.30 0.20 0.15 | 3 4 5 6 7 8 9 10 | 0.05 0.10 0.30 0.25 0.15 0.10 0.03 0.02 |
The minimum required rate of return from this investment is 16%.
The company has approached you as a financial management expert to perform an analysis of the above project.
Required:
| (i) | Using the following random numbers, perform 10 simulation runs of the net present value (NPV) of this project. 5397 6699 3081 1909 3167 8170 3875 4883 9033 5852 |
| (ii) | Determine the expected net present value (NPV) of the project. |
May 2016
3 Questions
Question 1b
Planet Ltd. is considering undertaking a 20-year project which requires an initial investment of Sh.250 million in a
real estate partnership and whose present value (PV) of expected cash flows is Sh.254 million. Planet Ltd. has the
option to abandon the project any time in the next five years for Sh.150 million. The variance in the present value
(PV) of the cash flows is 0.09 and the 5-year risk-free rate is 7%.
Required:
(i) The net present value (NPV) of the project including the option to abandon the project.
(ii) Comment on the results of your analysis in (b)(i) above.
Note:
1. The Black-Scholes Option Pricing Model
C = \(P_a\) N(\(d_1\)) - \(P_e\) N(\(d_2\))\(e^{-rt}\)
Where: \({\large
d_1 = \frac{ \ln\left( \frac{P_a}{P_e} \right) + \left( r + 0.5s^2 \right)t }{ s\sqrt{t} }
}\)
\(d_2 = d_1 - s\sqrt{t}\)
2. The Put-Call Parity Relationship
\(P = C - P_a + P_e e^{-rt}\)
Question 1a
In the context of appraisal of capital investments under conditions of uncertainty, explain four limitations of utility
analysis.
Question 3
On 1 January 2016, Mavuno Limited was in the process of raising funds to undertake four investment projects. These projects
required a total of Sh.30 million.
Given below are details relating to the four investment projects:
| Project | Required initial investment Sh. "million" | Internal rate of return (%) |
| A B C D | 8 7 9 6 | 26 16 20 22 |
Additional information:
| 1 | The company had Sh.9 million available from retained earnings as at I January 2016. Any extra equity finance would have to be sourced through an issue of new ordinary shares. |
| 2 | The market price per ordinary share on 1 January 2016 was Sh.25.60 ex-dividend. Information on earnings per share (EPS) and dividend per share (DPS) over the last 6 years is as follows: |
| Year ended 31 December | 2010 | 2011 | 2012 | 2013 | 2014 | 2015 | |
| EPS (Sh.) DPS (Sh.) | 4.5 2.5 | 4.8 2.8 | 4.9 2.9 | 5.2 30 | 5.5 3.2 | 6.0 3.5 |
| 3 | Issue of new ordinary shares would attract a floatation cost of Sh.4.60 per share. |
| 4 | 9% irredeemable debentures (par value of Sh.1,000 each) could be sold with net proceeds of 95% due to a discount on issue of 2% and a floatation cost of Sh.30 per debenture. The maximum amount available from the issue of the 9% irredeemable debenture would be Sh.4 million after which debt could only be obtained at 12% interest with net proceeds of 90% of par value. |
| 5 | 10% preference shares can be issued at a par value of Sh.80. |
| 6 | The company's capital structure, which is considered optimal, is as Sh. Equity capital 45% Preference share capital 30% Debenture capital 25% 100% |
| 7 | The corporate tax rate applicable is 30%. |
| 8 | The company has to exhaust internally generated funds before raising extra funds from external sources. |
Required:
(a) The levels of total new financing at which breaks occur in the weighted marginal cost of capital (WMCC) curve.
(b) The weighted marginal cost of capital (WMCC) for each of the 3 ranges of levels of total financing as determined in
(a) above.
(c) (i) Advise Mavuno Limited on the project(s) to undertake assuming that the projects are divisible.
(ii) Determine the optimal capital budget.
November 2015
1 Questions
Question 4a
(i). Define the term "free cash flow to equity".
(ii). Explain how free cash flow to equity could be used for valuation.
Pilot September 2015
1 Questions
Question 1
The managers of Kawaida Ltd. are investigating a potential Sh.25,000,000 investment. The investment would be a diversification away from existing mainstream activities into the food manufacturing industry. Sh.6,000,000 of the investment
would be financed by internal funds, Sh.10,000,000 by a rights issue and Sh.9,000,000 by long term loans. The investment is
expected to generate pretax net cash flows of approximately Sh.5,000,000 per year for a period of ten years. The residual value
at the end of year 10 is forecast to be Sh.5,000,000 after tax. As the investment is in an area that the government wishes to
develop a subsidised loan of Sh.4,000,000 out of the total Sh.9,000,000 is available. This will cost 2% below the company's
normal cost of long term debt finance which is 8%.
Kawaida Ltd.'s equity beta is 0.85, and its financial gearing is 60% equity and 40% debt by value. The average equity beta in
the food manufacturing industry is 1.2 and average gearing 50% equity and 50% debt by market value.
The risk free rate is 5.5% per annum and the market return is 12% per annum.
Issue costs are estimated to be 1% for debt financing (excluding the subsidised loan) and 4% for equity financing. These costs
are not tax allowable.
The corporate tax rate is 30%
Required:
(a) Estimate the adjusted present value (APV) of the proposed investment.
(b) Comment upon the circumstances under which APV might be a better method of evaluating a capital investment than
net present value (NPV).