CPA Quantitative Analysis – August 2022 Past Paper & Answers
Unit: Quantitative Analysis
19 QuestionsQuestions
Download CPA Quantitative Analysis August 2022 past paper with detailed answers and marking scheme. This paper is based on KASNEB examination standards and is ideal for revision and exam preparation.
Access the full paper online, download the PDF, or study offline. Each question includes step-by-step solutions to help you understand key concepts in Quantitative Analysis.
Production of each table requires 3 hours in the machining department, 5 hours in the assembly department and 4 hours in the finishing department. Production of a desk requires 4 hours in the machining department, 8 hours in the assembly department and 6 hours in the finishing department. Production of a chair requires 2 hours in the machining department, 3 hours in the assembly department and 5 hours in the finishing department.
The cost of an hour in the machining, assembly and finishing department is Sh.50, Sh.100 and Sh.150 respectively.
Required:
Using matrix algebra:
(i) Calculate the total number of hours required at each branch.
(ii) Calculate the total cost incurred at each branch and the total cost incurred by Soundex Company to supply the order.
| Month | January | February | March | April | May | June |
| Sales (Sh.“000”) | 80 | 76 | 78 | 82 | 72 | 82 |
| Day of the week | Number of employees |
| Monday | 207 |
| Tuesday | 185 |
| Wednesday | 203 |
| Thursday | 180 |
| Friday | 225 |
| Total | 1,000 |
To produce two units of Standard requires 240 minutes in the Cutting department, half the amount of time in the Assembly department and same amount of time in the Finishing department as in the Cutting department.
To produce one unit of Deluxe requires 60 minutes, 180 minutes and 60 minutes in Cutting, Assembly and Finishing departments respectively.
To produce three units of Luxury requires 180 minutes in Cutting department and twice the amount of time in both Assembly and Finishing departments.
The contribution per unit from Standard, Deluxe and Luxury is Sh.6, Sh.5 and Sh.2 per unit respectively.
Required:
(i) Formulate the above problem as a linear programming model.
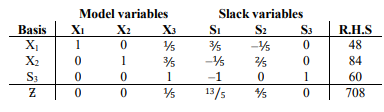
(ii) Prepare an initial simplex tableau to solve the above model.
(ii) Highlight four assumptions of Markov analysis.
| Payoff matrix | |||
| Demand | |||
| Product | Low | Moderate | High |
| \(S_1\) | 15 | 22 | 29 |
| \(S_2\) | 22 | 24 | 28 |
| \(S_3\) | 32 | 23 | 34 |
| \(S_4\) | 35 | 22 | 33 |
| Opinion | |||
| Students gender | In favour | Opposed | Undecided |
| Male | 40 | 10 | 15 |
| Female | 20 | 30 | 20 |
| Production per day (units) | Frequency in days |
| 230 – 260 | 12 |
| 260 – 290 | 18 |
| 290 – 320 | 25 |
| 320 – 350 | 52 |
| 350 – 380 | 35 |
| 380 – 410 | 15 |
| 410 – 440 | 9 |
| 440 – 470 | 6 |
| Month | Units produced “000” | Total cost of production Sh.“000” |
| December 2021 | 675 | 6,900 |
| January 2022 | 630 | 6,480 |
| February 2022 | 825 | 6,990 |
| March 2022 | 645 | 7,200 |
| April 2022 | 900 | 8,560 |
| May 2022 | 600 | 6,720 |
| June 2022 | 510 | 6,300 |
| July 2022 | 550 | 5,250 |
- 316 residents owned Nissan vehicles.
- 160 residents owned Honda vehicles.
- 360 residents owned Toyota vehicles.
- 120 residents owned both Nissan and Toyota vehicles.
- 56 residents owned both Nissan and Honda vehicles.
- 80 residents owned both Honda and Toyota vehicles.
- 240 residents did not own any of the three brands of vehicles.
| Profit Sh.“million” | Probability |
| 10 – 20 | 0.05 |
| 20 – 30 | 0.05 |
| 30 – 40 | 0.10 |
| 40 – 50 | 0.15 |
| 50 – 60 | 0.30 |
| 60 – 70 | 0.10 |
| 70 – 80 | 0.20 |
| 80 – 90 | 0.05 |
- MR = 600 – 0.12q
- Where q is the number of units produced and sold.
- Manufacturing department VC = 60q + 0.06\(q^2\)
- Assembly department VC = 12q + 0.03\(q^2\)
| Sh. | |
| Manufacturing department | 40,000 |
| Assembly department | 120,000 |
 Sign in with Google
Want to join the discussion?
Log in to post comments and interact with tutors.
Login to Comment